The 60-second cheat sheet (what each number means)
If you remember nothing else, remember this:
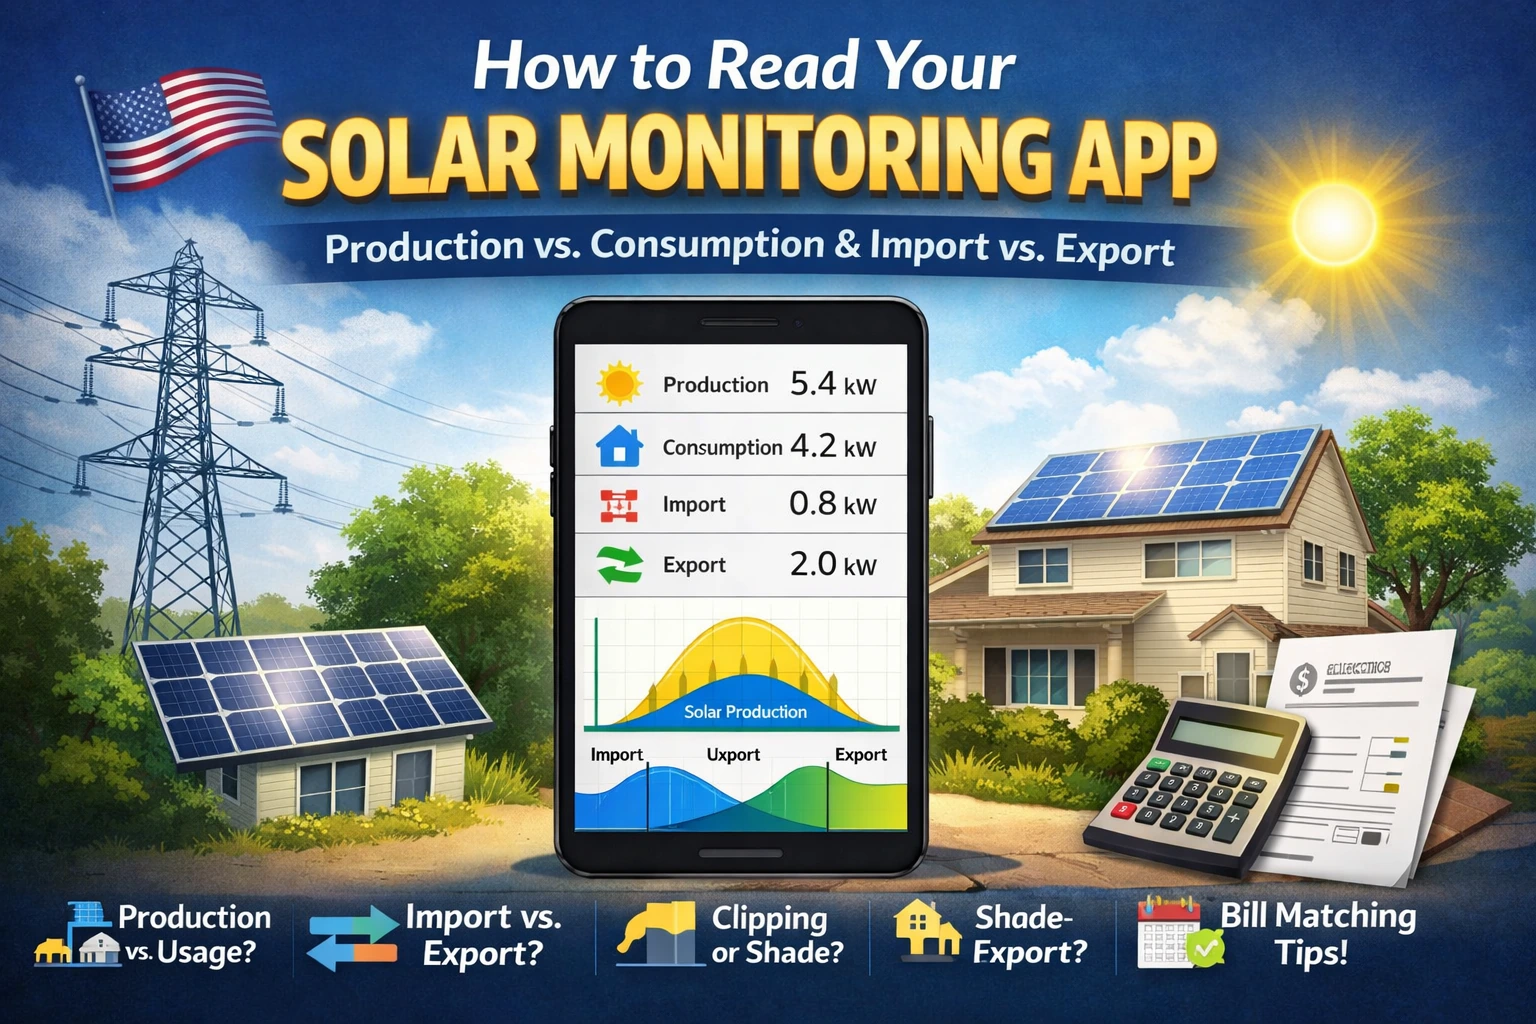
- Production = what your solar system generated.
- Consumption (usage) = what your home used.
- Import = what you pulled from the grid.
- Export = what you sent to the grid.
- Self-consumption = the portion of solar production you used in your home instead of exporting.
Many monitoring portals show these flows (solar → home → grid) when the right meters/sensors are installed. Source: SolarEdge Monitoring Portal User Guide.
Production (kWh / kW)
- kW = how much power your system is producing right now (speed).
- kWh = how much energy it produced over time (miles).
If you want a quick refresher on these two units (they’re the root of most confusion), read kW vs kWh for solar explained.
Consumption / Usage
This is your home’s demand (HVAC, lights, appliances, etc.). Some apps show this only if you have consumption monitoring installed (CTs/meters).
Import vs Export (grid)
- Import means your home needed more power than solar was providing, so you pulled the difference from the grid.
- Export means solar produced more than your home needed, so the extra flowed to the grid.
“Net” numbers
Some systems show “net” (import minus export) over a period. Net can be useful, but it can also hide detail—especially on time-of-use (TOU) plans where timing matters.
First, confirm what your system can actually measure
Before you interpret graphs, confirm whether your setup is:
1) Production-only monitoring (common)
You’ll usually see:
- Solar production (kW and kWh)
- Possibly inverter status, alerts, and panel-level production (if microinverters/optimizers)
You won’t reliably see:
- Home consumption
- Grid import/export
2) Production + consumption monitoring (requires CT clamps/meters)
To measure consumption and import/export, systems typically use CT clamps (current transformers) or meters installed at your main panel/service equipment.
Why this matters: if you don’t have consumption monitoring, your app may be perfectly correct about production—but it can’t tell you usage or import/export. That’s not a bug; it’s missing sensors.
Homeowner-safe check (no tools):
- In your app, look for tiles labeled Consumption, Import/Export, Grid, or Power Flow.
- If those are missing, ask your installer: “Do I have consumption CTs/meters installed and enabled in monitoring?”
How to read the dashboard like a pro (without being one)
kW vs kWh (quick practical meaning)
- Your app’s live power number (kW) is what your system is doing this moment.
- Your app’s daily energy (kWh) is what you should use to compare days, months, and seasons.
Daily view vs monthly view (use the right one)
- Daily graphs are great for pattern recognition (shade, clipping, clouds).
- Monthly totals are best for “is something wrong?” reality checks because weather and seasons swing production a lot.
If your goal is to compare “this year vs last year,” compare the same month year-over-year when possible.
The 6 most common solar monitoring graph shapes—and what they usually mean
These are “most likely” interpretations, not guarantees—but they’ll keep you from chasing the wrong problem.
1) Smooth bell curve on a clear day (usually normal)
A clean, rounded curve that rises in the morning, peaks near solar noon, then declines is what many systems look like on a clear day. Small wiggles can still be normal due to light clouds, haze, or micro-variations.
2) Flat-top plateau near midday (often clipping, not a defect)
If your graph rises smoothly and then hits a “ceiling” (flat top) around noon on clear days, that’s often inverter clipping—when DC power available from the array exceeds what the inverter can convert to AC at that moment.
Source: Sandia PVPMC (inverter saturation/clipping). Also see Solar inverter clipping explained (DC:AC ratio).
Safe check:
- Does the flat-top value roughly match your inverter’s AC rating (or total microinverter AC capacity)?
- Does it happen mainly on clear, cool-to-mild days with strong sun?
If yes, it’s likely normal-by-design.
3) Jagged dips and “teeth” (often shade or passing clouds)
A jagged line with repeated dips is commonly:
- Passing clouds (random dips, varies day to day), or
- Shade (more repeatable dips at similar times)
To learn how to recognize shade patterns safely from the ground, read solar panel shading explained (and how it affects output).
4) Sudden step-downs or missing chunks (alerts, comms, faults, or curtailment)
If production suddenly drops hard (like a step) and stays low, or the chart has missing time blocks, common causes include:
- Inverter or gateway communication issues
- System faults or protective shutdowns
- Utility/grid events (including export limits/curtailment in some setups)
Safe rule: if the app shows alerts/warnings, don’t guess—follow the manufacturer’s guidance and call your installer if it persists.
5) Lower peak on very hot days (temperature losses)
Panels are less efficient when they run hot, so it’s normal for output to be lower on extreme heat days even under bright sun.
This is one reason SolarBasicsHub teaches using a realistic “loss factor” (PR) for planning—not perfect-world math. Source: NREL PVWatts manual (default loss assumptions).
Related reading: Solar performance ratio (PR) explained.
6) “Zero production” during outages or before PTO (often normal status)
- If the grid is down, many grid-tied systems shut down for safety (anti-islanding). See do solar panels work during a power outage?
- If you’re waiting on PTO, your system may be off or limited until permission is granted. See solar permits, inspection, interconnection, and PTO explained
Monitoring vs your utility bill (the #1 confusion)
Billing cycle mismatch: your app dates may not match your bill dates
A super common scenario:
- Your bill covers (example) Jan 12–Feb 11
- Your app “monthly” view shows Feb 1–Feb 28
So you compare the wrong date windows and conclude “my bill is wrong” or “my app is wrong.”
SolarBasicsHub explains how to line up billing dates and solar-related charges in how to read your electric bill for solar (before & after going solar).
Fix (simple):
- Find your bill’s exact start/end dates.
- In your monitoring portal, set a custom date range matching those dates.
- Compare only after the date ranges match.
Exports don’t always offset imports 1:1 (net billing and TOU)
Even if you export a lot at noon, your evening imports can still cost money—especially under net billing (lower export credit) or TOU pricing (timing matters).
To understand why export credits can be worth less than imports in some plans, read net metering explained (and what net billing changes).
Safe troubleshooting workflow (no roof, no wiring, no panel-opening)
This homeowner-safe process helps you avoid expensive wrong turns.
Step 1) Compare the right time periods
- Compare clear days to clear days (not cloudy to sunny).
- Compare month-to-same-month year-over-year when possible.
Step 2) Identify the pattern type
| What you see in the app | Most likely meaning | Best next safe step |
|---|---|---|
| Smooth bell curve, stable day to day | Normal | Keep monitoring monthly |
| Flat-top plateau around noon on clear days | Clipping | Confirm inverter AC rating / ask installer for annual clipping estimate |
| Jagged dips at similar times daily | Shade pattern | Use the shading guide; consider design/MLPE options if impactful |
| Random jaggedness, changes daily | Clouds/weather | Compare multiple days; use monthly totals |
| Sudden step-down + alerts | Fault/communication | Follow alert guidance; call installer if persistent |
| Bill doesn’t match app month | Date mismatch / tariff rules | Align date ranges; review net metering/net billing terms |
Step 3) If you suspect a real issue, do only “safe checks”
- Confirm the system is “online” in the app (no error state).
- Compare multiple clear days.
- Check for new shade sources visible from the ground (tree growth, new structure).
- Confirm your date range matches the bill cycle.
If you need a structured “common causes” checklist, use why is my solar production low? (common causes & fixes).
Step 4) Know when to call a pro
Call your installer (or a licensed solar pro) if:
- You see persistent fault codes,
- Production drops sharply and stays low on clear days for multiple days,
- You suspect damage after severe weather,
- You’d need roof access or electrical access to investigate.
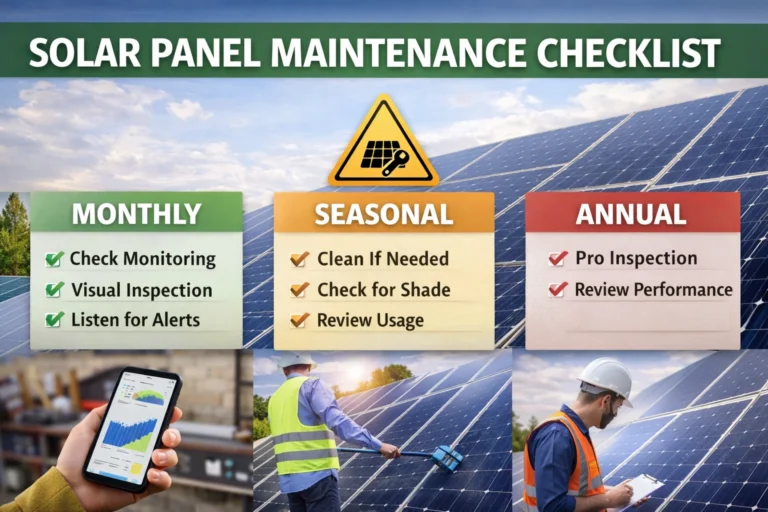
For a broader homeowner-safe troubleshooting mindset, see Solar panel maintenance & troubleshooting (complete guide).
What to ask your installer (copy/paste checklist)
Copy/paste this into an email:
- Do I have consumption monitoring installed (CT clamps/meters)? If yes, is it configured correctly in the portal?
- What is my inverter AC rating and my DC-to-AC ratio? (So I can interpret “flat-top” graphs.)
- Did you model shading? If yes, what tool/assumptions were used and what is the expected annual shade loss?
- If I’m on net billing/TOU: what export value assumptions were used in the savings model?
- What’s the best way to export my monitoring data (CSV/report) for warranty documentation if needed?
FAQ
1) Why does my solar app show kW and kWh?
kW is power “right now.” kWh is energy over time. kWh is the better number for comparing days/months.
2) My app doesn’t show consumption or import/export—why?
You may have production-only monitoring. Consumption and import/export typically require CT clamps/meters installed at your main panel/service equipment. Source: SolarEdge Monitoring Portal User Guide.
3) What does a flat-top solar production graph mean?
Often inverter clipping, especially if it happens on clear days around midday and the “ceiling” matches inverter AC limits. Source: Sandia PVPMC. For a homeowner-friendly explanation, see solar inverter clipping explained.
4) Why is my production lower on very hot days?
Heat reduces panel output—temperature losses are a normal real-world factor. Source: NREL PVWatts manual.
5) Why doesn’t my bill drop as much as my production suggests?
Common reasons include fixed charges, net billing export rates, TOU timing, and billing-cycle mismatch between app and bill. Start here: how to read your electric bill for solar.
6) How do I match my app to my utility bill?
Use a custom date range in the monitoring portal that matches the bill’s start/end dates, then compare.
7) When should I worry that something is wrong?
If you see persistent alerts, repeated dropouts, or a sharp sustained drop on clear days. Use: why is my solar production low? (safe troubleshooting).
Next to Read
- kW vs kWh for solar (simple explanation)
- Peak sun hours explained (estimate solar output)
- Solar performance ratio (PR) explained
- Solar inverter clipping explained (DC:AC ratio)
- Solar panel shading explained
- How to read your electric bill for solar
- Net metering explained (credits & net billing)
- Solar panel maintenance (complete guide)
- Why is my solar production low? (causes & fixes)