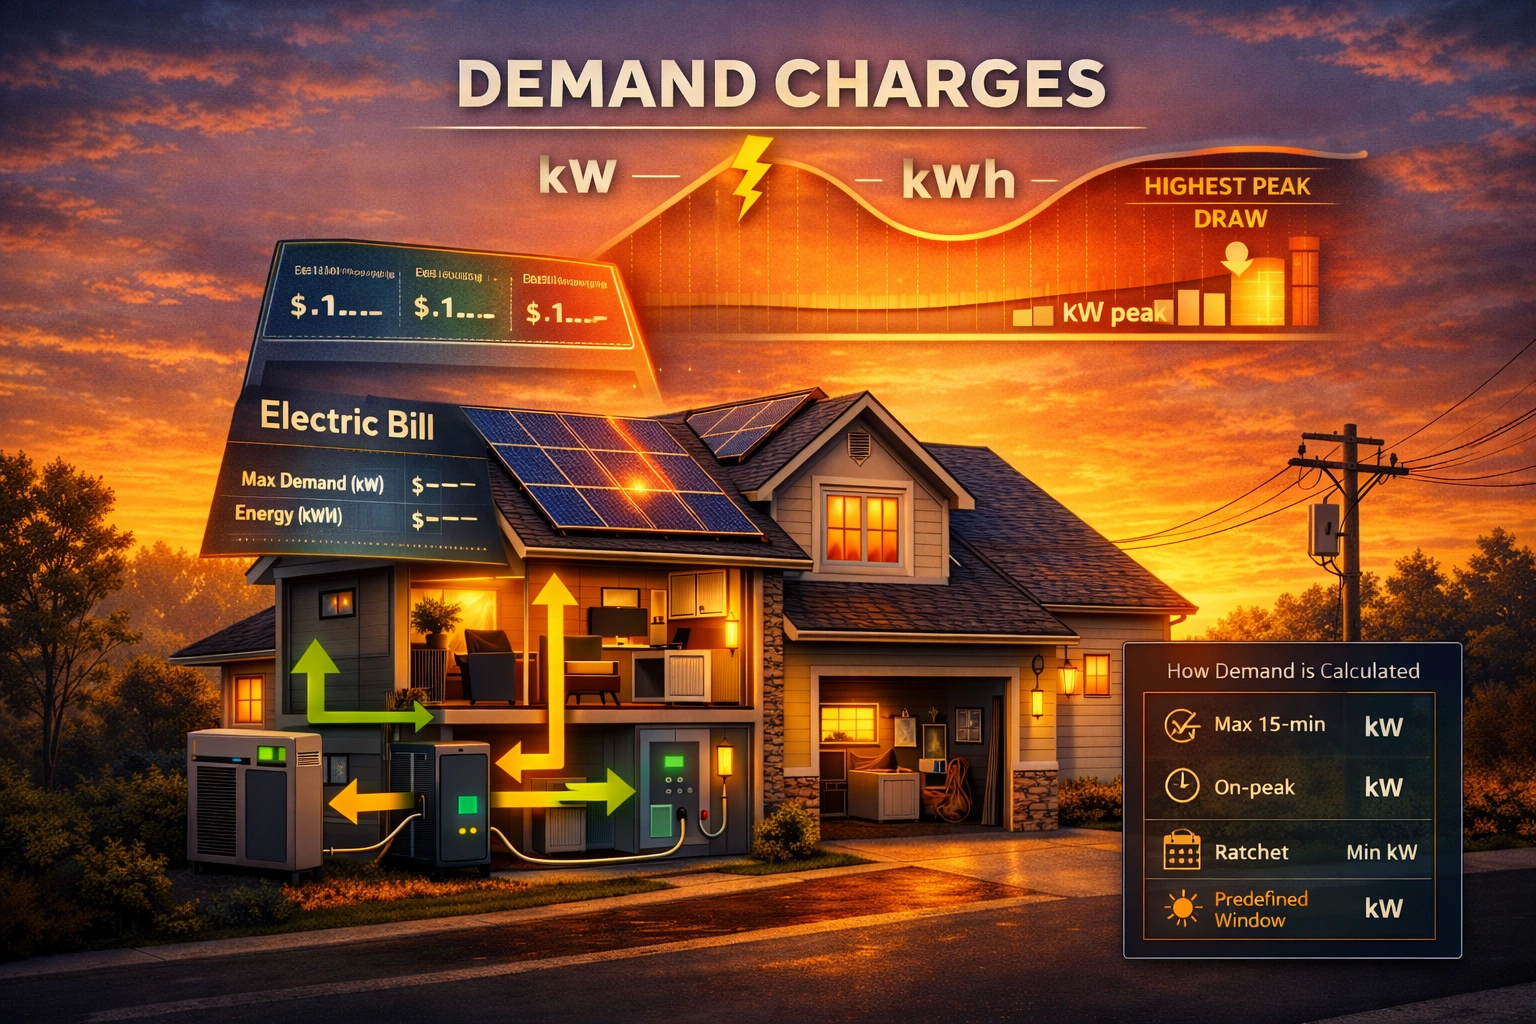
Key idea: Demand charges bill your highest power spike (kW) for the month, not just your total energy use (kWh). That means one “everything-on-at-once” moment can raise your bill even when your kWh looks normal.
The 60-second answer (demand charges in plain English)
A demand charge is the part of your electric bill based on your highest level of power use (your biggest “spike”) during the billing period—usually measured in kW. In contrast, your normal energy charge is based on total energy used over time—measured in kWh.
So you can have a month where your total kWh is reasonable, but a single moment (AC + oven + dryer + EV charging overlapping) sets a high peak and triggers a demand charge.
Safety note: This guide focuses on safe planning and behavior changes (scheduling, settings, questions to ask). For wiring, service panel work, or battery/EV charger installation, use a licensed professional.
Source: U.S. EIA glossary definition of “demand charge.”
Demand vs energy: kW vs kWh (why this is confusing)
If you’ve read SolarBasicsHub’s bill guide, you already know kWh is “how much energy” you used. Demand charges add a second dimension: how fast you used it (kW).
Bill basics: How to Read Your Electric Bill for Solar (Before & After Going Solar).
The one-sentence definitions
- kW (kilowatt) = power “right now” (the speed of electricity use)
- kWh (kilowatt-hour) = energy over time (the total amount used)
A simple analogy:
- kW is your car’s speed
- kWh is the miles driven
Where demand charges show up on a bill
Demand charges often appear as:
- “Demand (kW)”
- “Max Demand”
- “Billing Demand”
- “On-peak Demand” (if time-based)
Tip: If you see a kW line item, your plan is not just “kWh pricing.” It has a demand component.
How demand charges are calculated (the 4 designs you’ll see)
This is the most important section—because whether solar helps depends heavily on the rate design. Research (including NREL/LBNL) shows demand-based savings depend on how demand is measured and whether your home’s peak demand happens while solar is producing.
1) “Max 15-minute demand” (very common)
Your utility takes the highest average power you used over a short interval (often 15 or 30 minutes) and bills you for that peak. Tariffs may call this the “demand interval.”
Why it matters: If you run multiple high-power loads at the same time (even briefly), you can set the month’s peak.
Real-life example peak stack:
- AC turns on
- Oven preheats
- Dryer runs
- EV starts charging
2) Time-of-use demand charges (on-peak demand)
Some tariffs apply demand charges only during specific hours (similar to TOU energy pricing, but for kW). These can also vary by season.
Why it matters for solar: If the demand window is daytime, solar may help more. If it’s evening, solar helps less.
Source: U.S. DOE/FEMP overview of TOU demand charges and rate structures.
3) Demand “ratchets” (why one spike can haunt you)
A “ratchet” rule can set your billed demand as the current month’s peak or a percentage of a prior peak (often within the last 12 months). This is more common in some commercial/industrial tariffs, but if you see “ratchet” in your schedule, take it seriously.
Homeowner takeaway: One extreme event (heat wave + guests + EV charging) can raise bills for months.
4) Coincident peak / predefined peak window (when solar helps most)
Some designs look at demand during a predefined peak period (for example, a known afternoon window) or use longer averaging. PV tends to provide greater demand-charge savings when peak periods are predefined/daytime or averaging intervals are longer, and storage can improve “peak shaving.”
Source: NREL research on demand charge savings from PV and storage (depends strongly on demand-charge design).
Does solar reduce demand charges? The honest answer
Why residential demand often peaks in the evening
Many households hit their highest demand in the early evening (cooking, cooling/heating, laundry, showers, EV arrival charging). Solar output is usually dropping at that time.
Source: LBNL analyses note demand-charge savings can be small when the rate is based on peak demand at any time of day and residential peaks occur after solar production declines.
When solar helps (daytime peaks / predefined windows / longer averaging)
Solar can reduce demand charges more effectively when:
- Demand is measured during a daytime window (when solar is producing)
- The demand interval/averaging is longer (spikes get averaged down)
- The demand design is predefined peak aligned with daytime load
Source: NREL research highlights the importance of demand-charge design and coincidence with PV output.
When solar barely helps (anytime max demand)
If your demand charge is based on the highest 15-minute (or 30-minute) demand at any time, and your peak happens after sunset, solar alone may not reduce the billed peak much.
Translation: Your kWh can drop a lot, but the “kW demand” line may not.
The homeowner-safe “peak reduction” playbook
The goal is simple: avoid stacking big loads at the same time—especially during the hours your tariff uses for demand.
Step 1: Identify your peak-makers (common culprits)
Most homes set peak demand with a few big loads:
- Central AC / heat pump (especially with electric resistance backup heat)
- Electric dryer
- Electric oven + cooktop
- EV charging
- Pool pump (sometimes)
- Electric water heater (sometimes)
Step 2: Stop “load stacking” (the simplest win)
Peak demand is often not one appliance—it’s two or three overlapping. Try these safe, no-cost changes:
- Don’t run dryer and oven and EV charging at the same time
- Delay EV charging until after dinner (or schedule it)
- Run dishwasher after the dryer finishes
- If you must preheat the oven, don’t start laundry at the same time
Step 3: Use scheduling (even if your plan isn’t TOU)
Scheduling reduces simultaneous peaks:
- EV charging schedule
- Appliance delay-start
- Smart thermostat schedules
TOU foundation (still useful for scheduling logic): Time-of-Use (TOU) Rates and Solar.
Step 4: Thermostat pre-cool/pre-heat (comfort-safe)
If AC drives your peaks, you can often reduce peak stacking by shifting HVAC runtime earlier:
- Pre-cool slightly before your demand-prone window
- Raise the setpoint modestly during the window (comfort-first)
Health note: Keep changes modest and prioritize safety—especially for infants, seniors, and anyone sensitive to heat/cold.
Step 5: Water heating timing (thermal storage trick)
If you have an electric water heater or heat pump water heater, shifting heating cycles away from peak stacking times can help. Use manufacturer scheduling features when available. For timer installs, use a professional (no DIY wiring).
What NOT to do
- No DIY panel changes, breaker swaps, or EV circuit work
- Don’t disable safety settings in inverter/battery apps without understanding them
Batteries and demand charges (what they can and can’t do)
A battery can reduce demand charges by peak shaving: discharging during your highest demand moments so the grid sees a lower peak.
Peak shaving basics (plain English)
If your home jumps to 10 kW because multiple loads overlap, a battery that can discharge several kW may reduce what the grid sees—maybe down to 6–7 kW—lowering your billed demand.
Why battery kW matters as much as kWh
For demand charges, power (kW) often matters more than stored energy (kWh). A large kWh battery with low kW output might not shave a sharp spike effectively.
Related: Solar Battery kW vs kWh (What the Specs Really Mean).
Reserve settings tradeoffs (backup vs savings)
If you keep a high backup reserve, you may have less battery capacity available for peak shaving.
Decision checklist: what should you do next?
- Confirm you actually have demand charges
Look for “Demand (kW)” or “Max Demand” on your bill.
Bill guide - Find the demand rule
Is it anytime max demand? On-peak demand only? What’s the averaging interval (15-min vs 60-min)? Any ratchet? - Identify your peak event
Use monitoring if you have it, or reconstruct what was running together.
Monitoring guide - Try scheduling for 2 weeks
Stagger loads, reschedule EV charging, adjust thermostat scheduling. - If peaks persist and demand charges are significant
Consider battery peak shaving only after confirming your battery’s kW can cover your peak-shaving goal.
Table: Demand-charge designs vs best strategies
| Demand charge design (what utility measures) | Solar impact (typical) | Best homeowner strategy | When a battery helps most |
|---|---|---|---|
| Anytime max demand (15–30 min) | Often limited (peaks may be evening) | Stop load stacking; reschedule EV; thermostat scheduling | If battery kW can cover short spikes |
| On-peak demand window (daytime) | Often better (PV aligns with window) | Avoid stacking in the window; run flexible loads under solar | Strong if peaks occur inside the window |
| Predefined daytime peak / longer averaging | PV can reduce billed demand more effectively | Align loads with solar; reduce midday peaks | Battery + PV can compound savings |
| Ratchet design | One spike can affect many months | Avoid rare extreme peaks; plan for heat-wave behavior | Battery can “cap” worst spikes if sized for kW |
FAQ
1) Are demand charges common for residential customers?
Historically they were more common for larger customers, but some utilities have introduced residential demand-based options or pilots. If you see a kW demand line on your bill, you’re already on a demand plan.
2) What’s the simplest way to reduce demand charges?
Stop running multiple high-power appliances at the same time (“load stacking”). That’s often the fastest no-cost improvement.
3) Will solar panels alone eliminate my demand charge?
Not necessarily. If your demand peak occurs after sunset, PV may not reduce the peak that sets your bill. Source: LBNL analyses on residential demand charge designs and peak timing.
4) How is demand (kW) typically measured?
Often as the highest average usage over a demand interval (commonly 15 or 30 minutes), depending on the tariff.
5) If I add a battery, what spec matters most for demand charges?
The battery’s continuous power (kW) is critical for shaving peaks. kWh matters too, but kW is what caps spikes. See: Solar Battery kW vs kWh.
6) Does TOU matter if I have demand charges?
Sometimes yes—some tariffs have TOU demand charges (demand measured only in specific hours). Source: U.S. DOE/FEMP rate-structure overview.
7) What if my bill mentions a “ratchet”?
Treat it as a warning that a single high peak can raise your billed demand for future months. Ask your utility to explain the ratchet rule in plain language.
Next to Read
- How to Read Your Electric Bill for Solar (Before & After Going Solar)
- Time-of-Use (TOU) Rates and Solar
- How to Read Your Solar Monitoring App
- Solar Self-Consumption Explained
- Solar Battery kW vs kWh
- Solar Battery Backup Reserve
- How to Size a Solar Battery for Backup
- Solar Export Limits & Curtailment