Quick answer: what “Performance Ratio (PR)” means
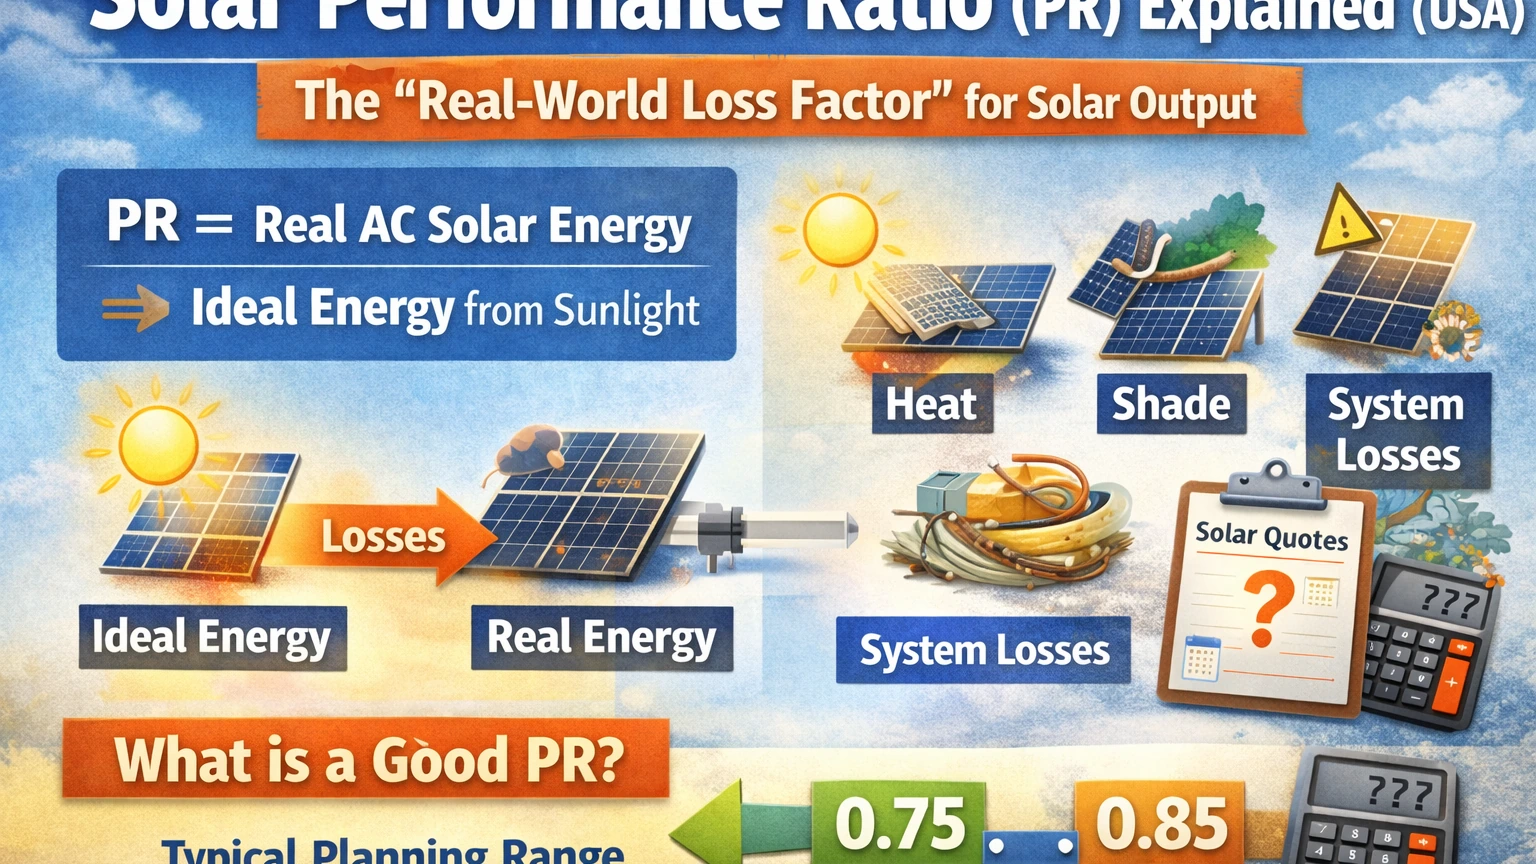
Solar performance ratio (PR) is a simple, unitless number that tells you how close your solar system’s real output is to what it could produce under the available sunlight after accounting for real-world losses.
In plain English: PR is your “reality factor.” It’s used in the PV industry and is defined in standards (IEC 61724) and discussed in NREL performance work as a common way to measure PV system performance. Source: NREL PR discussion and IEC reference. :contentReference[oaicite:17]{index=17}
PR in one sentence (homeowner version)
PR ≈ real AC energy ÷ “ideal” energy from the sunlight your system received.
If your estimate assumes “perfect” conversion, PR is what brings it back to reality: heat, inverter conversion, wiring, mismatch, dirt, shading, and downtime.
PR vs efficiency vs capacity factor (don’t mix them)
- Panel efficiency = how much sunlight becomes DC electricity per panel area (a module spec).
- PR (performance ratio) = how well the whole system turns available sunlight into usable energy after losses.
- Capacity factor = how much energy you produced relative to running at full rated power 24/7 (more of a grid/plant metric).
The standard idea behind PR (plain English)
PR exists because weather changes constantly. A cloudy month should not make your system look “broken” compared to a sunny month. PR is meant to normalize performance so you can judge system health more fairly, and it’s commonly used for acceptance and operations testing. Source: NREL “Weather-Corrected Performance Ratio” overview and report context. :contentReference[oaicite:18]{index=18}
“How effectively sunlight becomes AC energy”
NREL describes PR as comparing what you generated to what you would have generated if the plant consistently converted sunlight at the level expected from the DC nameplate rating (conceptually). Source: NREL PR description. :contentReference[oaicite:19]{index=19}
Why homeowners should care
Because PR answers two high-stakes questions:
- “Is my quote realistic?” (or did someone assume unrealistically low losses?)
- “Is my system underperforming?” (or is this just normal heat/season/shade?)
The PR formula (and the homeowner-friendly version)
The IEC-style concept (final yield / reference yield)
In standards-based language, PR is often framed as the ratio of a system’s final yield to a reference yield (IEC 61724). You’ll also see PR described as a metric that measures how effectively a PV plant converts collected sunlight into AC energy. Source: NREL PR report referencing IEC 61724. :contentReference[oaicite:20]{index=20}
Homeowner shortcut: “ideal kWh × PR = expected kWh”
For planning, you can treat PR like a single multiplier:
Expected energy ≈ Ideal energy × PR
Your site already uses a beginner-friendly estimate format with peak sun hours (PSH):
Daily kWh ≈ System size (kW) × Peak Sun Hours × PR
(That’s exactly why PR is the missing “learning path” step.) :contentReference[oaicite:21]{index=21}
What PR does NOT include (or sometimes mixes in)
Different tools and dashboards may treat downtime differently:
- Some “performance ratio” calculations focus on times when the system is available.
- Some “energy ratio” metrics include availability/downtime in the same number.
Source: U.S. DOE performance/energy ratio definitions discussion. :contentReference[oaicite:22]{index=22}
What PR captures: the real-world losses bucket
Think of PR as a bucket that holds many small losses (and a few big ones) that separate “nameplate potential” from “real kWh.”
1) Temperature / heat losses
Panels produce less power when they’re hot. This is why very hot summer days can show lower peaks than a mild spring day—even under strong sun. PVWatts documentation and solar performance literature treat temperature as a key driver of real output. Source: PVWatts guidance and NREL performance work. :contentReference[oaicite:23]{index=23}
2) Inverter conversion (and why PR is about AC energy)
Your panels make DC power, but your home/grid uses AC power. The inverter conversion step introduces losses. That’s one reason PR is often discussed in terms of AC output. Source: PR description in NREL report framing PR around AC energy conversion effectiveness. :contentReference[oaicite:24]{index=24}
3) Clipping (a “loss” that can be a design choice)
Clipping happens when your panels could produce more DC power than your inverter can convert to AC at that moment. It looks like a smooth flat-top plateau on clear days. It may reduce some energy, but it’s often a deliberate design tradeoff. Your clipping guide covers this and cites Sandia PVPMC behavior. :contentReference[oaicite:25]{index=25}
Read: https://solarbasicshub.com/solar-inverter-clipping-dc-ac-ratio/
4) Wiring, mismatch, and “normal system losses”
Even with perfect sun, there are everyday losses from wiring resistance, minor mismatch between panels, and conversion steps. PVWatts includes a “losses” concept specifically because these real-world losses exist in every system. :contentReference[oaicite:26]{index=26}
5) Soiling (dust/pollen) and shading
Soiling tends to reduce output more uniformly (a lower curve). Shading can cause sharper dips or disproportionate losses depending on array design and inverter architecture.
Read: https://solarbasicshub.com/solar-panel-shading/
6) Curtailment / export limits (PR confusion alert)
If your utility or interconnection requires an export limit, your system may reduce output (curtail) even on sunny days to stay under the export cap. That can look like “lost production,” but it may be a grid rule rather than a hardware problem. :contentReference[oaicite:27]{index=27}
Read: https://solarbasicshub.com/solar-export-limits-curtailment/
What is a good performance ratio for solar?
There isn’t one universal “good PR” number for every home because PR depends on climate, design, shading, inverter behavior, and how the metric is calculated. Still, many planning discussions treat PR as a “typical range” rather than a fixed constant—your own Peak Sun Hours guide uses a typical planning range of about 0.75 to 0.85 for quick estimates. :contentReference[oaicite:28]{index=28}
Why climate and roof design change PR
- Hot roofs → more temperature losses → lower PR.
- Shade patterns → larger loss swings → lower PR unless mitigated by design.
- Orientation/tilt changes when you produce (and how much). PR doesn’t replace good design; it explains reality after design.
Direction/tilt guide: https://solarbasicshub.com/best-direction-for-solar-panels-usa/
Why inverter type can change what you “observe”
Microinverters, optimizers, and string inverters can behave differently under shade and clipping. That can affect daily curve shapes and how homeowners interpret “performance.” (This is why you already link shading + clipping + monitoring together.)
How to use PR to sanity-check PVWatts and solar quotes
Where PR hides in PVWatts (“losses”)
PVWatts asks for “system losses.” That losses number is essentially a way to represent PR-like reality inside the calculator: higher losses → lower effective PR; lower losses → higher effective PR. PVWatts is designed for planning-level estimates and explains why inputs like losses matter. :contentReference[oaicite:29]{index=29}
PVWatts guide: https://solarbasicshub.com/pvwatts-solar-production-estimate/
A safe, repeatable quote check process
- Get your quote’s system size (DC kW) and the estimated annual kWh.
- Run PVWatts with the same size, tilt, azimuth, and realistic losses.
- Compare monthly kWh, not just annual (seasonality reveals bad assumptions).
- If the quote is much higher, ask: “What losses/shading/curtailment assumptions did you use?”
Use these supporting guides as your “inputs checklist”:
- Peak Sun Hours Explained
- How to Read Your Electric Bill for Solar
- How to Read Your Solar Monitoring App
PR troubleshooting: when low PR is normal vs when to call a pro
Start with the simplest reality checks
- Compare the same month year-over-year (season matters).
- Compare multiple clear days (clouds/haze distort conclusions).
- Match your monitoring date range to your utility bill period (to avoid false alarms). :contentReference[oaicite:30]{index=30}
Use “shape clues” before guessing a cause
- Smooth flat top near midday (clear days) → often clipping. :contentReference[oaicite:31]{index=31}
- Jagged dips or repeating “cuts” → often shade. :contentReference[oaicite:32]{index=32}
- Ceiling that matches an export cap → possible curtailment/export limit. :contentReference[oaicite:33]{index=33}
Safety note (USA-friendly)
This article is for education and planning. Do not climb onto roofs, open electrical equipment, or touch wiring. If you see persistent alerts, repeated dropouts, or a sharp sustained production drop on clear days, contact a licensed solar professional. (This matches the safety posture used across your troubleshooting and maintenance content.) :contentReference[oaicite:34]{index=34}
Maintenance guide: https://solarbasicshub.com/solar-panel-maintenance-complete-homeowner-guide-cleaning-inspections-troubleshooting/
Decision table: PR symptom → likely cause → best next action
| What you see | Likely explanation | Best next action (safe) |
|---|---|---|
| Lower peaks on very hot days | Normal temperature losses | Compare to mild clear days; use PVWatts monthly view for realism |
| Smooth flat-top around midday (clear days) | Inverter clipping (often normal) | Check inverter AC rating; estimate annual impact; read clipping guide |
| Jagged dips or repeating cuts | Shading pattern | Identify shade timing from ground + monitoring; read shading guide |
| “Ceiling” tied to export cap behavior | Export limit / curtailment | Confirm export cap settings; read export limits guide |
| Sudden sustained drop vs last year | Outage, fault, new obstruction, or monitoring issue | Check alerts + compare multiple clear days; call pro if persistent |
FAQ
1) What is solar performance ratio (PR) in simple terms?
PR is a “reality factor” that compares your real energy output to the output you’d expect from the sunlight your system received after accounting for real-world losses. Source: NREL PR description and IEC framing. :contentReference[oaicite:35]{index=35}
2) Is PR the same as panel efficiency?
No. Efficiency is a panel spec; PR reflects whole-system performance (heat, inverter conversion, wiring, shade, soiling, downtime).
3) What is a good performance ratio for solar?
It varies by climate and design. For planning-level estimates, many homeowner models treat PR as a typical range rather than a fixed value; your Peak Sun Hours guide uses roughly 0.75–0.85 as a common planning range. :contentReference[oaicite:36]{index=36}
4) How does PVWatts relate to PR?
PVWatts includes a “losses” input to represent real-world losses that PR captures conceptually. Lower losses imply higher effective PR; higher losses imply lower effective PR. :contentReference[oaicite:37]{index=37}
5) Can clipping lower PR?
Yes—clipping is energy you don’t capture during peak moments. But it can be a deliberate design choice, and the real question is annual impact. :contentReference[oaicite:38]{index=38}
6) Can export limits make my “performance” look worse?
Yes. Curtailment/export limits can reduce output even on sunny days due to grid rules, which can look like “lost production.” :contentReference[oaicite:39]{index=39}
7) Where should I go next after PR?
Use PR together with Peak Sun Hours and PVWatts to sanity-check estimates, then use monitoring/shading/clipping guides to interpret real graphs.