Quick answer: what PVWatts is (and what it’s good for)
PVWatts is a free online calculator from the National Renewable Energy Laboratory (NREL) that estimates how much electricity (kWh) a grid-tied solar system can produce using a few simple inputs.
PVWatts is best for:
- Planning-level estimates before you sign a quote
- Comparing roof directions (south vs west vs east) using the same system size
- Sanity-checking proposals that look unusually optimistic
PVWatts is not best for:
- Complex shading (trees/buildings shading different parts of the roof at different times)
- Multiple roof planes in one run (you’ll want to run separate scenarios)
- Exact financial modeling (it’s production-focused, not a full bill simulator)
Source: NREL PVWatts estimates PV energy using simple inputs; PVWatts documentation describes assumptions and “system losses.” (Source: https://pvwatts.nrel.gov/ and PVWatts v5 manual PDF.)
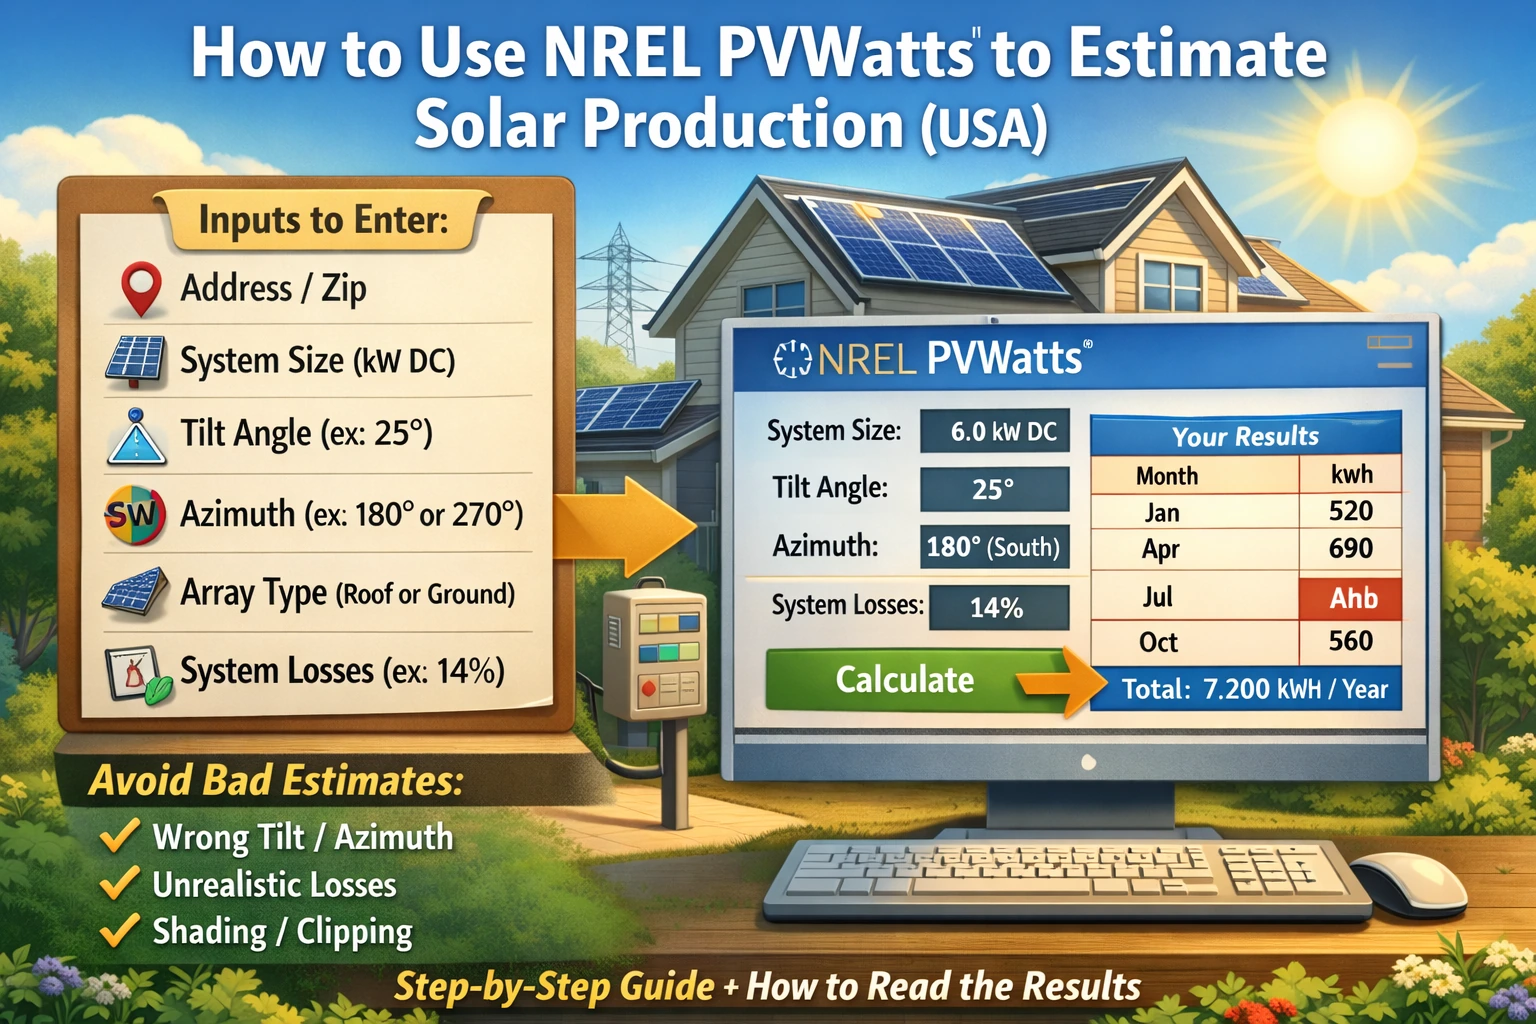
Before you start: the 6 inputs you need (homeowner-safe)
You can run PVWatts quickly if you gather these inputs first:
1) Location (address or ZIP)
PVWatts uses your location to pull solar resource (sunlight) and weather data. Use your home ZIP or city for a good planning estimate.
2) DC system size (kW)
This is the total panel nameplate rating in kilowatts DC (kW). Example: 16 panels × 400 W = 6,400 W = 6.4 kW DC.
If you’re still learning units, read: kW vs kWh in Solar: What They Mean
3) Module type (keep it simple)
For homeowners, it’s usually safe to leave module type at a typical modern option. The bigger accuracy wins come from correct size, tilt, azimuth, and realistic losses.
4) Array type (roof mount vs ground mount)
If your system will be on your roof, choose the roof-mounted fixed option. Ground mounts can behave differently because airflow can cool panels better (slightly improving output), and tilt/orientation may be optimized.
5) Tilt and azimuth (the most common mistake)
Tilt = how steep the panels are (degrees from flat). Many rooftop systems are close to roof pitch.
Azimuth = compass direction expressed as degrees:
- 0° = North
- 90° = East
- 180° = South
- 270° = West
Source: PVWatts uses azimuth degrees; SolarBasicsHub also explains azimuth and direction here: Best Direction for Solar Panels (USA).
6) System losses (what the default “14%” means)
PVWatts includes a System Losses input to represent real-world losses (soiling, wiring, mismatch, connections, etc.). The PVWatts v5 manual describes a default total system losses value of 14%.
Source: PVWatts v5 Manual (PDF): https://pvwatts.nrel.gov/downloads/pvwattsv5.pdf
Homeowner rule: If you’re not sure, keep the default losses for planning. Adjust losses only if you have a clear reason (heavy soiling/snow, unusual wiring, known shading patterns, etc.).
Step-by-step: run PVWatts in about 10 minutes
Step 1: Open PVWatts and enter your location
Go to PVWatts and enter your address, city, or ZIP. Then select the correct location result.
Source: PVWatts site: https://pvwatts.nrel.gov/
Step 2: Enter DC system size (kW)
Use the panel total (kW DC). If you’re comparing quotes, run PVWatts using each quote’s stated DC size so you’re comparing fairly.
Step 3: Choose array type and module type
For most homeowners, pick a standard roof-mounted fixed array option. Leave module type at a modern standard unless you have a specific panel technology you need to model.
Step 4: Enter tilt and azimuth (do this carefully)
If you don’t know your exact tilt, a reasonable planning approach is to:
- Use your roof pitch/tilt from the quote (best), or
- Use a typical roof tilt estimate and then run one more scenario with tilt ±10° to see sensitivity.
If you’re comparing roof directions, keep everything the same and only change azimuth (e.g., 180° vs 270°).
Step 5: Leave system losses at default (unless you have a reason)
PVWatts defaults system losses to a typical value. If your roof is dusty, near construction, or has known soiling issues, you can test a “higher loss” scenario.
Tip: Save a baseline run first. Then create a second run where you change only one input at a time.
Step 6: Run the calculation and save the monthly results
Your most important output is the monthly energy (kWh) table. That’s the number you’ll compare to your annual usage and your utility rate structure.
How to read PVWatts results (what matters and what doesn’t)
Monthly kWh is the #1 output
Most homeowner decisions are based on energy (kWh), not peak power (kW). Compare the monthly kWh table to your monthly electric usage if possible.
Related: How to Read Your Electric Bill for Solar
Why “best day” thinking misleads people
Solar varies by season and weather. A system can look amazing on one clear spring day but produce much less in winter or during smoky/hazy periods. That’s why PVWatts monthly output is more useful than a single-day comparison.
Capacity factor is a context metric, not a homeowner goal
PVWatts may show capacity factor. It’s useful for context, but homeowners should focus on:
- Annual kWh estimate
- Monthly pattern (summer vs winter)
- How that lines up with your bills and rates
Make your PVWatts estimate more realistic (without overthinking it)
1) Shading: PVWatts can’t “see” your trees
PVWatts is not a detailed shade model. If you have trees or obstructions that shade panels during prime sun hours, PVWatts may overestimate output unless you adjust assumptions or run a more shade-aware analysis.
Start here: Solar Panel Shading Explained
2) Hot climates and heat losses (why summer peaks can be lower than expected)
Panels lose efficiency when they run hot. That’s one reason real-world output can dip on extreme-heat days even under strong sun.
For realistic planning, SolarBasicsHub uses a “loss factor” concept in output estimates (PR / performance factor) alongside peak sun hours.
Read: Peak Sun Hours Explained
3) Clipping and DC-to-AC ratio (how PVWatts relates to inverter limits)
If your panels are large relative to your inverter AC rating, your system can hit an AC “ceiling” during strong sun. That can make the midday curve flatten (clipping) and reduce some peak output while still improving mornings/evenings.
Read: Solar Inverter Clipping Explained (DC-to-AC Ratio)
PVWatts vs installer proposals: how to compare fairly
If you want to sanity-check a proposal, make sure you’re comparing apples-to-apples:
- Same DC size (kW) as the quote
- Same azimuth and tilt assumptions (roof plane matters)
- Same “loss realism” (don’t use unrealistically low losses to make numbers look better)
If a proposal estimate is far above PVWatts, ask the installer to explain why—using specific inputs (tilt, azimuth, shading assumptions, losses).
Helpful: How to Compare Solar Quotes
Copy/paste checklist: questions to ask your installer
- What roof plane did you model (tilt and azimuth)? Can you show those numbers?
- What shading assumptions did you use? Did you do a shade analysis?
- What system losses/derate assumptions are in your production model?
- What DC size (kW) and inverter AC size (kW) are you quoting (DC-to-AC ratio)?
- Can you provide monthly kWh estimates (not just annual)?
- How does your estimate change under net billing / TOU rates where midday export is worth less?
Related context on export value: Net Metering Explained (and what Net Billing changes)
Table: a simple “scenario runner” you can use
| Scenario | What you change | Why it’s useful | What to compare |
|---|---|---|---|
| Baseline | Your best tilt/azimuth + default losses | Planning starting point | Annual + monthly kWh |
| Direction test | Change azimuth (e.g., 180° vs 270°) | See south vs west value tradeoff | Monthly pattern shift |
| Loss sensitivity | Test losses +3% to +6% | Stress-test dusty/shaded/complex installs | Annual kWh drop |
| Tilt sensitivity | Tilt ±10° | Check if tilt uncertainty matters | Winter vs summer change |
FAQ
1) Is PVWatts accurate?
PVWatts is widely used for preliminary estimates and is best treated as a planning tool. Accuracy depends heavily on your inputs and whether your roof has shading or unusual conditions.
2) What does “system losses” mean in PVWatts?
System losses represent typical real-world losses (soiling, wiring, mismatch, connections, etc.). PVWatts v5 documentation describes a default total system losses value of 14%.
Source: https://pvwatts.nrel.gov/downloads/pvwattsv5.pdf
3) Should I change the default losses?
Only if you have a clear reason. For most homeowners, leaving defaults is a reasonable planning approach. If you suspect heavy soiling or shading, run a “higher losses” scenario as a stress test.
4) How do I find my roof azimuth and tilt?
Your installer quote should list tilt and azimuth (or roof plane direction). If it doesn’t, ask for it—because those assumptions strongly affect output estimates.
See examples: Best Direction for Solar Panels (USA)
5) Why does PVWatts show high summer production?
Summer has longer days and often higher solar resource. But very hot temperatures can reduce panel efficiency, and shading patterns can change with sun angle—so don’t judge performance from a single “best” month.
6) Can PVWatts model multiple roof directions?
Not well in one run. If you have panels on two roof planes (like east + west), run PVWatts separately for each direction and compare scenarios. Then ask your installer for a combined estimate using professional tools.
Next to Read (SolarBasicsHub)
- Peak Sun Hours Explained: A Simple Way to Estimate Solar Output
- Best Direction for Solar Panels (USA)
- Solar System Components & Sizing Basics
- Solar Panel Shading Explained
- Solar Inverter Clipping Explained (DC-to-AC Ratio)
- How to Read Your Electric Bill for Solar
- Net Metering Explained (and Net Billing)
- How to Compare Solar Quotes